
[squeak-dev] histogram-based profiling tools on Mac OS X?Eliot Miranda eliot.miranda at gmail.comSat Jul 12 02:46:43 UTC 2008
Hi Colin,
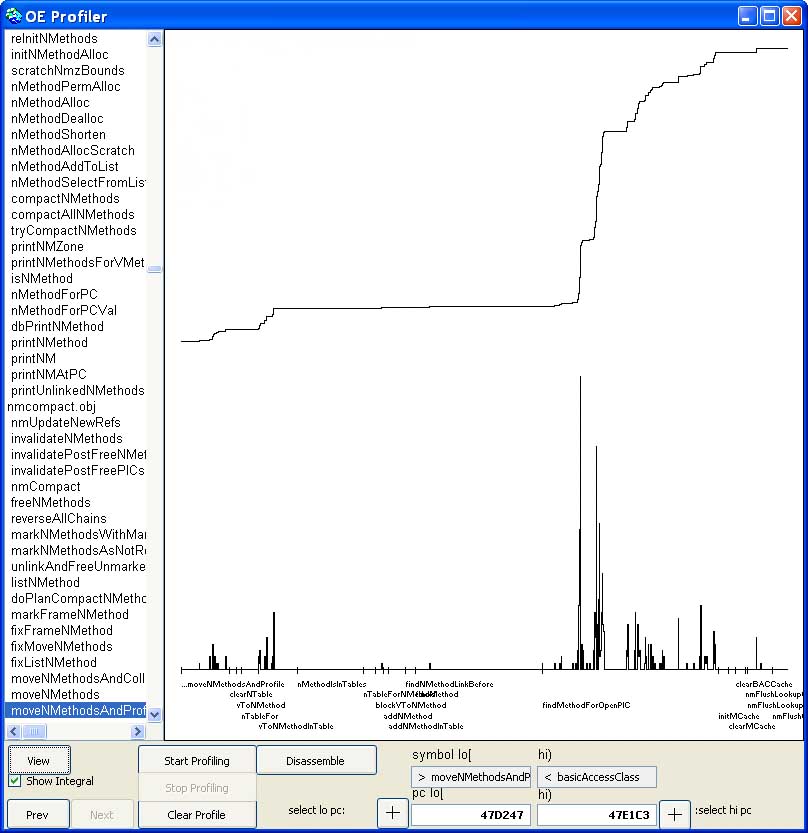
this is much closer to (and nicer than) what I had in mind. But it
seems time-based. Does it include tools to relate to PC?
(e.g. a la http://www.mirandabanda.org/images/oeprofiler.jpg)
On Fri, Jul 11, 2008 at 6:36 PM, Colin Putney <cputney at wiresong.ca> wrote:
>
> On 11-Jul-08, at 6:23 PM, Avi Bryant wrote:
>
> Unless I'm misunderstanding what you're asking for, you already have
>> one installed:
>> /Developer/Applications/Performance Tools/Shark.app
>>
>> Eg:
>> http://developer.apple.com/tools/images/codeProfile.jpg
>>
>> Avi
>>
>> On Fri, Jul 11, 2008 at 6:16 PM, Eliot Miranda <eliot.miranda at gmail.com>
>> wrote:
>>
>>> Hi All,
>>> I'm badly in need of a histogram-based profiler for the VM I'm working
>>> on. This is something that produces a histogram of time taken against
>>> PC,
>>> insead of time taken against function.
>>>
>>
> Another option would be DTrace/Instruments, if you're running Leopard.
>
>
> http://developer.apple.com/documentation/DeveloperTools/Conceptual/InstrumentsUserGuide/Introduction/chapter_1_section_1.html
>
>
>
-------------- next part --------------
An HTML attachment was scrubbed...
URL: http://lists.squeakfoundation.org/pipermail/squeak-dev/attachments/20080711/4b7bcd2e/attachment.htm
More information about the Squeak-dev mailing list |