
[squeak-dev] Please try out | Fixes for debugger invocation during code simulationThiede, Christoph Christoph.Thiede at student.hpi.uni-potsdam.deThu Mar 11 18:52:14 UTC 2021
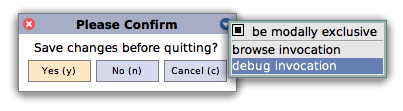
Thanks a lot for the collaboration, Marcel! :-)


> We basically figured out that the debugger that pops up from an unhandled error (or warning) must never try debugging a simulated process but always the "genuine process", which is the one that is actually running and which may do the code simulation for another process.

A small summary of this bug for all interested readers who are not yet familiar with the debugging machinery: The actual issue causing all the debugger chains was a mechanism called process-faithful debugging. In a nutshell, it makes sure that when you debug an expression such as "Process activeProcess", the expression answers the correct process instance even when being debugged (that is, it must answer the process being debugged instead of the debugger process which is responsible for the debugging). Process-faithful debugging works by redirecting all sends to ProcessorScheduler >> #activeProcess to a so-called #effectiveProcess. However, when some error occurred in the debugging process during a debugging step (that is, a simulation error such as [1] [2] occurred), a second debugger was opened - but because #activeProcess was just being subjected to redirection, this second debugger did not interrupt the debugging process but the process being debugged instead. As a consequence, the faulty debugging process kept running and was given the opportunity to do any other harm. If you now take a look into how Object >> #at: or Object >> #doesNotUnderstand: are implemented (that is, by unlimited recursion), you will see that it could fire one debugger after the next one this way, without limitation, causing the infinite debugger chains that broke your images.

The solution, in its simplest form, was pretty straightforward: When opening a debugger from an error (see StandardToolSet >> #handleError: and others), make sure not to honor process-faithful debugging but always open the debugger on the actually running process, which we decided to call genuineProcess for sake of differentiation from #activeProcess. The rest of the changeset focuses on some additional refactoring of the overall debugging API on Process and ProcessorScheduler, striving to make it more intuitive for application developers to choose the right process and context for debugging.

If you want to learn even more details, the first thread provided by Marcel should be quite interesting (though also quite long). Otherwise, we'll be here for your questions. :-)

What an interesting project this has been! I'm already looking forward to the next one! :-)

Best,
Christoph

[1] http://forum.world.st/The-Trunk-Kernel-ct-1357-mcz-td5124373.html
[2] http://forum.world.st/BUG-REGRESSION-while-debugging-Generator-nextPut-tp5108125.html

________________________________
Von: Squeak-dev <squeak-dev-bounces at lists.squeakfoundation.org> im Auftrag von Taeumel, Marcel
Gesendet: Donnerstag, 11. März 2021 18:01:55
An: squeak-dev
Betreff: [squeak-dev] Please try out | Fixes for debugger invocation during code simulation

Hi all!

Christoph put in a lot of effort to figure out the cause of infinite debugger chains under various circumstances. He is curious how far "debugging the debugger" can work and how possible improvements to code simulation might look like.

We basically figured out that the debugger that pops up from an unhandled error (or warning) must never try debugging a simulated process but always the "genuine process", which is the one that is actually running and which may do the code simulation for another process.

Please find attached a change set with that fix. Tests are in "DebuggerTests" and "ProcessTest". The most interesting methods are ProcessorScheduler >> #debugContext:title:full:contents: and Process >> #debugWithTitle:full:contents:. Please take a look at their comments.

We will merge this into Trunk in a some days, given that there are no objections. :-)

Related discussions:
http://forum.world.st/I-broke-the-debugger-tp5110752p5110814.html
http://forum.world.st/The-Inbox-Morphic-ct-1610-mcz-tp5108228.html

Best,
Marcel and Christoph

P.S.: Debugging a dialog invocation looks nicer now. Try it out.
[cid:88c0dc63-3136-44f8-9b3a-fd5e947e85be]
-------------- next part --------------
An HTML attachment was scrubbed...
URL: <http://lists.squeakfoundation.org/pipermail/squeak-dev/attachments/20210311/e31047cc/attachment-0001.html>
-------------- next part --------------
A non-text attachment was scrubbed...
Name: image.png
Type: image/png
Size: 13738 bytes
Desc: image.png
URL: <http://lists.squeakfoundation.org/pipermail/squeak-dev/attachments/20210311/e31047cc/attachment-0001.png>
More information about the Squeak-dev mailing list |