
[squeak-dev] Please try out | Fixes for debugger invocation during code simulationNicolas Cellier nicolas.cellier.aka.nice at gmail.comFri Mar 12 02:13:55 UTC 2021
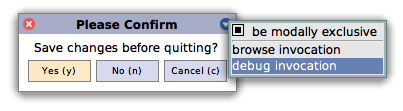
Great explanation and great findings!


Le jeu. 11 mars 2021 à 19:52, Thiede, Christoph <
Christoph.Thiede at student.hpi.uni-potsdam.de> a écrit :

> Thanks a lot for the collaboration, Marcel! :-)
>
>
> > We basically figured out that the debugger that pops up from an
> unhandled error (or warning) must never try debugging a simulated process
> but always the "genuine process", which is the one that is actually running
> and which may do the code simulation for another process.
>
> *A small summary of this bug* for all interested readers who are not
> yet familiar with the debugging machinery: The actual issue causing all the
> debugger chains was a mechanism called *process-faithful debugging.* In a
> nutshell, it makes sure that when you * debug an expression such as
> "Process activeProcess",* the expression answers the correct process
> instance even when being debugged (that is, it must answer the *process **being
> debugged* instead of the *debugger process* which is responsible for the
> debugging). Process-faithful debugging works by *redirecting all sends to
> ProcessorScheduler **>> **#activeProcess to a so-called #effectiveProcess*
> *.* However, when some error occurred in the debugging process during
> a debugging step (that is, *a simulation error* such as [1] [2]
> occurred), a second debugger was opened - but because #activeProcess was
> just being subjected to redirection, this second debugger did not interrupt
> the *debugging process* but the *process being debugged* instead. As a
> consequence, *the faulty debugging process kept running* and was given
> the opportunity to do any other harm. If you now take a look into how
> Object >> #at: or Object >> #doesNotUnderstand: are implemented (that
> is, by *unlimited recursion*), you will see that *it could fire one
> debugger after the next one* this way, without limitation, causing the
> infinite debugger chains that broke your images.
>
> *The solution,* in its simplest form, was pretty straightforward: *When
> opening a debugger from an error* (see StandardToolSet >> #handleError:
> and others), make sure *not to honor process-faithful debugging* but
> always open the debugger on the actually running process, which we decided
> to call *genuineProcess* for sake of differentiation from #activeProcess.
> The rest of the changeset focuses on some *additional refactoring of the
> overall debugging API* on Process and ProcessorScheduler, striving to
> make it more intuitive for application developers to choose the right
> process and context for debugging.
>
> If you want to learn even more details, the first thread provided by
> Marcel should be quite interesting (though also quite long). Otherwise,
> we'll be here for your questions. :-)
>
> What an interesting project this has been! I'm already looking forward to
> the next one! :-)
>
> Best,
> Christoph
>
> [1] http://forum.world.st/The-Trunk-Kernel-ct-1357-mcz-td5124373.html
> [2]
> http://forum.world.st/BUG-REGRESSION-while-debugging-Generator-nextPut-tp5108125.html
>
> ------------------------------
> *Von:* Squeak-dev <squeak-dev-bounces at lists.squeakfoundation.org> im
> Auftrag von Taeumel, Marcel
> *Gesendet:* Donnerstag, 11. März 2021 18:01:55
> *An:* squeak-dev
> *Betreff:* [squeak-dev] Please try out | Fixes for debugger invocation
> during code simulation
>
> Hi all!
>
> Christoph put in a lot of effort to figure out the cause of infinite
> debugger chains under various circumstances. He is curious how far
> "debugging the debugger" can work and how possible improvements to code
> simulation might look like.
>
> We basically figured out that the debugger that pops up from an unhandled
> error (or warning) must never try debugging a simulated process but always
> the "genuine process", which is the one that is actually running and which
> may do the code simulation for another process.
>
> Please find attached a change set with that fix. Tests are in
> "DebuggerTests" and "ProcessTest". *The most interesting methods are
> ProcessorScheduler >> #debugContext:title:full:contents: and Process >>
> #debugWithTitle:full:contents:. *Please take a look at their comments.
>
> We will merge this into Trunk in a some days, given that there are no
> objections. :-)
>
> Related discussions:
> http://forum.world.st/I-broke-the-debugger-tp5110752p5110814.html
> http://forum.world.st/The-Inbox-Morphic-ct-1610-mcz-tp5108228.html
>
> Best,
> Marcel and Christoph
>
> P.S.: Debugging a dialog invocation looks nicer now. Try it out.
>
>
>
-------------- next part --------------
An HTML attachment was scrubbed...
URL: <http://lists.squeakfoundation.org/pipermail/squeak-dev/attachments/20210312/f293d149/attachment.html>
-------------- next part --------------
A non-text attachment was scrubbed...
Name: image.png
Type: image/png
Size: 13738 bytes
Desc: not available
URL: <http://lists.squeakfoundation.org/pipermail/squeak-dev/attachments/20210312/f293d149/attachment.png>
-------------- next part --------------
A non-text attachment was scrubbed...
Name: image.png
Type: image/png
Size: 13738 bytes
Desc: not available
URL: <http://lists.squeakfoundation.org/pipermail/squeak-dev/attachments/20210312/f293d149/attachment-0001.png>
More information about the Squeak-dev mailing list |