
Hi Chris,
Many thanks for the patience in helping me out! I have considered using Glorp instead of Magma, but Magma is simply fantastic and I want to see how far I can take it. I understand that I might need to say “it is not the correct tool” if the dataset is too large of course, but I really want it to work.
On 30 May 2018, at 22:03, Chris Muller asqueaker@gmail.com wrote:
17.2% {2814ms} MaHashIndex>>writeRecord: 17.1% {2799ms} MaFileRecordBroker>>writeFrom:at:
So, for example, if there are two indexes on a MagmaCollection, each object added to that collection cause MaHashIndex>>#add:at: to be called FIVE times (once for MC, plus twice for each index).
Yes - I think this is my biggest problem. Some more details from my application - consider the following log entry (Yes - I am aware that is a bit of a data blurb):
1.2.3.4 127.0.0.1 connector-26 _2_1 [15/Mar/2018:23:59:59 +1100] "GET /branding/_1_1/unimelb-logo.svg HTTP/1.1" 200 52157 "Mozilla/5.0 (Macintosh; Intel Mac OS X 10.11; rv:58.0) Gecko/20100101 Firefox/58.0” "session_id=A3EC4123E563D3D2B6DE990D3C9923FF; s_session_id=EFD19A7163EF5C1B071C6D608997D3AB; web_client_cache_guid=9ddf5c31-6554-4439-bb31-2bb8d23c0575; JSESSIONID=8EF936432E3E4E8EED8BBA6AD9E7EAC6; __utmb=100687569.1.10.1521117448" 2 52157
When I started to “magmafying” the application, I decided that the most common things that I need to access/query from the 2-3 million entry log file were the following: sessionId (A3EC4123E563D3D2B6DE990D3C9923FF) userId (_2_1) requestEnd (15/Mar/2018:23:59:59 +1100) requestStart (requestEnd - 2) requestTimeInMilliSeconds (2) status (200)
Hence, I created a bunch of indexes on the MagmaCollection:
MaDateAndTimeIndex attribute: #requestEnd. MaDateAndTimeIndex attribute: #requestStart. MaIntegerIndex attribute: #requestTimeInMilliSeconds. TKMaHTTPStatusCodeIndex attribute: #status (MaSearchStringIndex attribute: #sessionId) beAscii; yourself. (MaSearchStringIndex attribute: #userId) beAscii; yourself.
Since #status return symbols corresponding to http return codes (i.e. 200 = #OK, 500=#InternalServerError), I created a custom index and implemented indexHashForIndexObject: to lookup the numeric value for the symbol. A typical distribution in a random log looks like this (status code, count)
200 779878 206 2469 301 51 302 92769 304 4997 400 3 401 558 403 6 404 816 500 1932
This ties into your comment here:
On top of this, MaHashIndexes are inefficient at adding duplicate keys because, even though it is quick to locate the first of any key in the file, it has to read sequentially the remainder to find the end where to append the new duplicates. It may be possible to design a fix to this.
Hence, the are going to be massive amount of duplicates for 200. This is why I see decrease of commit times here:
| 84.9% {101572ms} [] MaHashIndex>>add:at: | 34.1% {40852ms} MaHashIndexRecord>>canAdd: | |34.0% {40710ms} MaHashIndexRecord>>eligibleByteArrayIndexesFor:do: | | 32.8% {39235ms} SmallInteger(Number)>>to:by:do: | | 29.8% {35690ms} primitives | | 3.0% {3545ms} [] MaHashIndexRecord>>eligibleByteArrayIndexesFor:do: | | 1.8% {2213ms} [] MaHashIndexRecord>>canAdd: | | |1.2% {1495ms} MaHashIndexRecord>>hasSlotAvailableAtByteArrayIndex: | | 1.1% {1332ms} primitives | 30.1% {36041ms} MaHashIndex>>selectRecord: | |29.9% {35736ms} MaHashIndex>>readRecord:at: | | 28.6% {34246ms} MaFileRecordBroker>>readInto:at: | | 28.5% {34126ms} MaAtomicFileStream>>maRead:bytesFromPosition:of:atFilePosition: | | 28.5% {34049ms} Mutex>>critical: | | 27.9% {33371ms} BlockClosure>>ensure: | | 25.8% {30893ms} [] MaAtomicFileStream>>maRead:bytesFromPosition:of:atFilePosition: | | |24.4% {29143ms} MaAtomicFileStream>>writerAt: | | | |24.3% {29112ms} BTree>>from:do: | | | | 24.0% {28682ms} BTree>>from:to:keysAndValuesDo: | | | | 23.6% {28255ms} BTreeInteriorNode>>leavesFrom:to:do: | | | | 21.2% {25331ms} BTreeInteriorNode>>leavesFrom:to:do: | | | | 18.6% {22208ms} BTreeInteriorNode>>leavesFrom:to:do: | | | | 16.5% {19754ms} BTreeInteriorNode>>leavesFrom:to:do: | | | | 14.3% {17105ms} BTreeInteriorNode>>leavesFrom:to:do: | | | | 11.7% {14000ms} BTreeInteriorNode>>leavesFrom:to:do: | | | | 9.3% {11163ms} BTreeInteriorNode>>leavesFrom:to:do: | | | | 6.9% {8296ms} BTreeInteriorNode>>leavesFrom:to:do: | | | | 3.6% {4263ms} BTreeLeafNode>>leavesFrom:to:do: | | | | |2.7% {3246ms} [] BTree>>from:to:keysAndValuesDo: | | | | | 2.6% {3125ms} BTreeLeafNode(BTreeNode)>>keysAndValuesDo: | | | | | 2.1% {2463ms} BTreeKeysArray(BTreeKeys)>>withIndexDo: | | | | | 1.4% {1632ms} [] BTreeLeafNode(BTreeNode)>>keysAndValuesDo: | | | | | 1.1% {1324ms} [[]] BTree>>from:to:keysAndValuesDo: | | | | 1.4% {1626ms} BTreeKeysArray(BTreeKeys)>>findIndexForKey: | | | | 1.3% {1573ms} BTreeKeysArray(BTreeKeys)>>withIndexDo: | | |1.4% {1657ms} SmallInteger(Magnitude)>>min:
Now, the distribution of #sessionId and #userId is harder to predict but the amount of sessionId should be far less and hence the lookup in hash index not as taxing (?).
Since log entries represents a point in time, I was wondering whether I could try to “batch” log entries in timespans and use DateTree for storage but there is one problem here: that class uses a dictionary for events - hence the readSet are going to be very large and it is not easy to “stubOut” unless I subclass DateTree and change storage type somehow. I would also loose the ability to use a MagmaCollectionReader on the whole dataset and find things such as specific users regardless of when the entry was logged.
The other idea is to change the model to create a tree based on the sessionId (which _might be missing_, unfortuantely), but then I would loose the ability to quickly retrieve entries based on #requestStart regardless of sessionId.
Mutex>>critical: MaNetworkServerLink>>submit: [] in [] in [] in MagmaSession>>submit:to: [] in [] in BlockClosure>>maOn:do:on:do:on:do: BlockClosure>>on:do:
If you have another debugger open inside the Mutex then, yes, the next one will wait.
You should be able to close the other debugger, then proceed the one doing the disconnect.
Well, actually this seems to be a left over from that I abandoned "MaObjectSerializationUserError: No createProxyBlock specified.” dialogue. The process was suspended and the I get an unwind exception on the containing MethodContext.
This can happen if an object changed while it was being serialized. This is not supported. Are you serializing in a separate Process?
I had kicked of the reading/parsing/committing in background process, yes - I did not touch any of the entries what I am aware of, but, of course - it might be the case that I changed a participating class while it was mid serialisation. Thanks for this - it helps a lot.
When my image gets this wrecked and I can't abort it (e.g., exit image without saving), then I use clean up utility methods:
MagmaSession cleanUp. "print it. It closes and cleans up all in memory MagmaSessions and their references, reports the number of intstances before->after." MaInstaller chasePointerToAnyMagmaSession "Pick any MagmaSession instance and show the trail references to facilitate getting rid of it with another run of MagmaSession cleanUp.”
Perfect - thanks a lot for this!
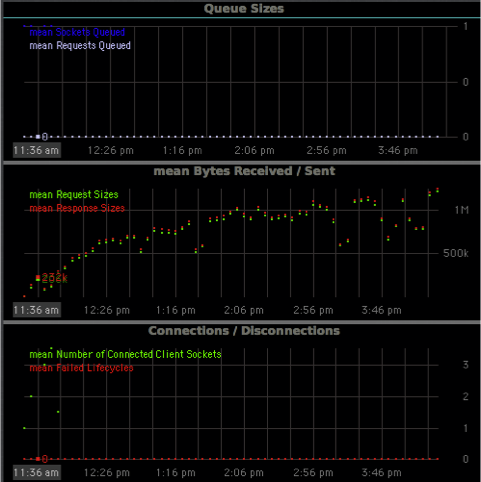
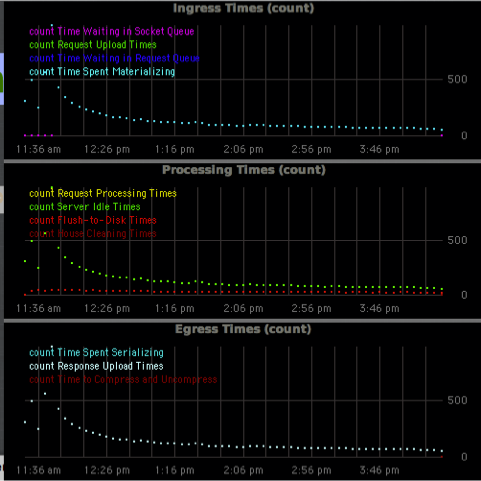
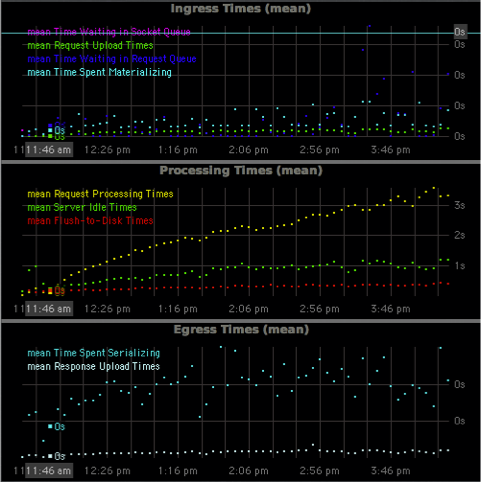
If you are further interested, I have attached a server profiling when performance on the Magma db degraded too much). Oh - the obligatory server statistic charts that visualises the degradation: