
... at http://www.mirandabanda.org/files/Cog/VM/VM.r3684
CogVM binaries as per VMMaker.oscog-eem.1834/r3684
General: Correct undue sign extension wile promoting 32 to 64 bits int in fetchLong64:ofObject: This was causing trouble in non spur object memory (V3).
Fix slowdown of update on 64-bit x64 by using int variables for the tides in sqExternalSemaphores.c and inline assembler for the sqCompareAndSwap in sqAtomicOps.h.
Fix slips in offset time primitives. They need to pop argumentCount + 1, not argumentCount.
Define an optional primitive as the fast primitive fail code so that unselected optional primitives are in the prmitiveTable as fast primitive fails.
Spur: Have WideString>>at: fail to answer an out-of-range character in the interpreter primitive (as well as in the JIT).
Fix bug in following state on primitive failure. The old code would always follow to depth 1, even if the accessor depth was 0. Hard-code primitiveSize's depth to 0 (accessing length in at:[put:] and size causes the stack depth computation to answer 1 instead of 0 for these primitives.
Fix assert and dequeueMourner for case where mournQueue is nil.
- fixed a bug in receiver accessing in immutability primitive for mirror primitive.
- change primitiveSetOrHasIdentityHash to patch the class table if the new hash is set to a behavior (the primitive knows it's a behavior if the second (optional) argument is true) For example: FullBlockClosure tryPrimitive: 161 withArgs: {38.true}
No longer follow the method and context fields in a closure in activateNewClosureMethod:numArgs:mayContextSwitch:; the caller will have failed if these are forwarders, so no need to check again.
Cogit: Add a primitive that answers pc map data for methods which can be used to better decorate methods in the VM Profiler. Refactor the pc map enumeration facilities so that the Sista pic data primitive can share the same enumerator. Do this by collapsing the isBackwardBranch and annotation parameters into a single parameter.
Follow selectors in the openPICList post Spur become.
Fix the ARM's caller-saved register mask now that we can name all the actual registers.
Reworked machine code generation of immutability so for common stores it uses a single trampoline for both store checks and immutability checks.
- improved support for register allocation: branch merge successfully compiled with register moved instead of spilling.
Sista Cogit: Don't bother to add counters to conditional jumps implementing and: and or:. Added the remote inst var access bytecode in sista V1 bytecode set without interfering with existing code.
Plugins: Upgrade LargeIntegersPlugin to v2.0 LargeInteger primitives now deal with 32-bits digits. No change to image code.
Memory is 8 bytes aligned on Spur. When storing 32/64 bits large integers values, allways fill the eight bytes whatever the effectivily used size, rather than bother with dissertion of size.
Generate integer type checking as C macros rather than direct/indirect interpreterProxy function call in plugins. This, and 32-bit accessing mean singificantly faster large integer arithmetic.
Fix primAlienReplace to use positiveMachineIntegerValueOf: instead of positive32BitValueOf:.
BitBltPlugin operates on 32bit word units, therefore it's better to declare its operands as 'unsigned int' rather than sqInt. On 32bit VM, this doesn't change anything, but on 64bits spur, it makes this snippet work:
| wideString source pos blt expectedWideString | source := #[1 64 255 14 1 64 48 251]. expectedWideString := WideString fromByteArray: source. wideString := WideString new: source size // 4. pos := 0. blt := (BitBlt toForm: (Form new hackBits: wideString)) sourceForm: (Form new hackBits: source). blt combinationRule: Form over; sourceX: 0; sourceY: pos // 4; height: wideString byteSize // 4; width: 4; destX: 0; destY: 0; copyBits. wideString restoreEndianness. self assert: wideString = expectedWideString
Hence it fixes loading/diffing MCZ with wide character.
Mac OS Builds: Don't link with -fvisibility=hidden; it breaks external plugins. Use -fvisibility=default instead. This fixes e.g. UnixOSProcessPlugin on Mac OS X.
Windows Builds: The Windows VMs are no longer "dpiAware". If you want one-to-one pixel mapping check the README for ins ructions. It's a simple edit. _,,,^..^,,,_ best, Eliot

On 23 Apr 2016, at 21:48, Eliot Miranda eliot.miranda@gmail.com wrote:
Dear Eliot,
... at http://www.mirandabanda.org/files/Cog/VM/VM.r3684
CogVM binaries as per VMMaker.oscog-eem.1834/r3684
thank you for the new release. I re-ran my TCAP decoding benchmark and this release is comparable to the previous one and as such slower than the < 3500 releases were.
kind regards holger

Hi Holger,
I ran the Shootout benchmarks[1] which I'd recently updated on cogspurlinuxht 3397 and 3648 using the latest Squeak Trunk image, and the latter performed better in three benchmarks: reverseComplement (-20%), pidigits (-30%) and fasta (-40%). For the rest, the performance of the two VMs were the same. So, I suspect there's an area not covered by these benchmarks where you experience the slowdown. Or there's some other difference responsible for the slowdown. Can you tell us more about your benchmark? Have you tried profiling it?
Levente

Could you provide an image / a change file / something with the TCAP bench ? I need to run it under the VM profiler to understand what is going on and where the slow down come from.
On Wed, Apr 27, 2016 at 12:37 AM, Levente Uzonyi leves@caesar.elte.hu wrote:
Hi Holger,
I ran the Shootout benchmarks[1] which I'd recently updated on cogspurlinuxht 3397 and 3648 using the latest Squeak Trunk image, and the latter performed better in three benchmarks: reverseComplement (-20%), pidigits (-30%) and fasta (-40%). For the rest, the performance of the two VMs were the same. So, I suspect there's an area not covered by these benchmarks where you experience the slowdown. Or there's some other difference responsible for the slowdown. Can you tell us more about your benchmark? Have you tried profiling it?
Levente
Hi,
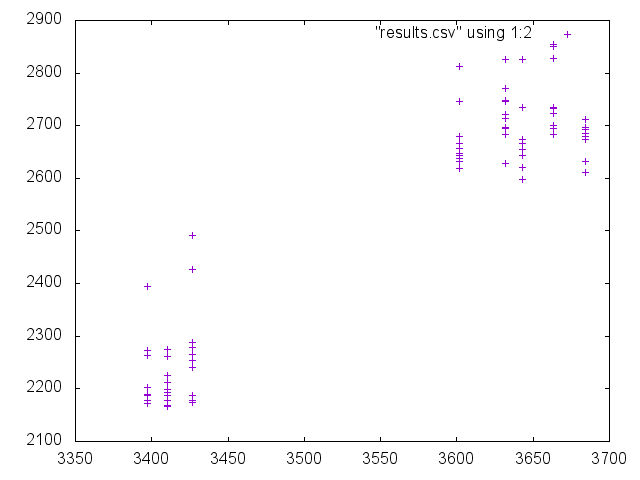
So after *really* struggling I profiled Holger's code.
I put results in attachment with version 3427 and version 3684 of the VM.
Holger said the code is not open-source, so if you want more information about the code ask him (or I guess I can answer if it's for a specific method).
The code execution is well spread around the methods. It's difficult to conclude.
It seems (I say, it seems) that the execution spend more time in recent versions in PICs. It could be that the machine code produced there is different because of: - the abstraction with 32/64 bits - the abstraction over literals for ARM - the design changes, if I understood correctly now PIC are created from a prototype. Now it could be something else.
I have no time to investigate further right now. Maybe we should try to generate PICs in 3427 and 3684 and check if the machine code is different. Which VMMaker version is 3427 ?
What do you guys think ?
Hi Clément,
On Wed, Apr 27, 2016 at 7:03 AM, Clément Bera bera.clement@gmail.com wrote:
Hi,
So after *really* struggling I profiled Holger's code.
I put results in attachment with version 3427 and version 3684 of the VM.
Holger said the code is not open-source, so if you want more information about the code ask him (or I guess I can answer if it's for a specific method).
The code execution is well spread around the methods. It's difficult to conclude.
It seems (I say, it seems) that the execution spend more time in recent versions in PICs. It could be that the machine code produced there is different because of:
- the abstraction with 32/64 bits
- the abstraction over literals for ARM
- the design changes, if I understood correctly now PIC are created from a
prototype. Now it could be something else.
I have no time to investigate further right now. Maybe we should try to generate PICs in 3427 and 3684 and check if the machine code is different. Which VMMaker version is 3427 ?
What do you guys think ?
It could be the longer jump in the new PICs, but I really doubt it. But there's something wrong with the VM profiler on linux. It is not showing any code in the interpreter run-time, and that might be hiding the real reason. I'll look at this as soon as I have time, but am committed to other things today and tomorrow.
_,,,^..^,,,_ best, Eliot
Hi Clément,
On Wed, Apr 27, 2016 at 10:28 AM, Eliot Miranda eliot.miranda@gmail.com wrote:
Hi Clément,
On Wed, Apr 27, 2016 at 7:03 AM, Clément Bera bera.clement@gmail.com wrote:
Hi,
So after *really* struggling I profiled Holger's code.
I put results in attachment with version 3427 and version 3684 of the VM.
Holger said the code is not open-source, so if you want more information about the code ask him (or I guess I can answer if it's for a specific method).
The code execution is well spread around the methods. It's difficult to conclude.
It seems (I say, it seems) that the execution spend more time in recent versions in PICs. It could be that the machine code produced there is different because of:
- the abstraction with 32/64 bits
- the abstraction over literals for ARM
- the design changes, if I understood correctly now PIC are created from
a prototype. Now it could be something else.
I have no time to investigate further right now. Maybe we should try to generate PICs in 3427 and 3684 and check if the machine code is different. Which VMMaker version is 3427 ?
What do you guys think ?
It could be the longer jump in the new PICs, but I really doubt it. But there's something wrong with the VM profiler on linux. It is not showing any code in the interpreter run-time, and that might be hiding the real reason. I'll look at this as soon as I have time, but am committed to other things today and tomorrow.
_,,,^..^,,,_ best, Eliot
and now that I'bve checked the PCI code again I'm really curious whether a different entry code (for PICs and methods) would be any faster overall. I would test changing xorl %ecx, %ecx call cePICAbort0Args nop Li: andl $0x00000001, %eax jmp Lc nop Le: *movl %edx, %eax* * andl $0x00000003, %eax* jnz Li movl %ds:(%edx), %eax andl $0x003fffff, %eax Lc: cmpl %ecx, %eax jnz Lnextcase movl $0x0, %ebx jmp theMethod.noCheckEntry to xorl %ecx, %ecx call cePICAbort0Args nop Li: *movl %edx, %eax* andl $0x00000001, %eax jmp Lc nop Le: *tstl $0x00000003, %edx* jnz Li movl %ds:(%edx), %eax andl $0x003fffff, %eax Lc: cmpl %ecx, %eax jnz Lnextcase movl $0x0, %ebx jmp theMethod.noCheckEntry
It saves an instruction in the non-iummediate case and has just as many instructions in the immediate case.
_,,,^..^,,,_ best, Eliot
On Wed, Apr 27, 2016 at 7:28 PM, Eliot Miranda eliot.miranda@gmail.com wrote:
Hi Clément,
On Wed, Apr 27, 2016 at 7:03 AM, Clément Bera bera.clement@gmail.com wrote:
Hi,
So after *really* struggling I profiled Holger's code.
I put results in attachment with version 3427 and version 3684 of the VM.
Holger said the code is not open-source, so if you want more information about the code ask him (or I guess I can answer if it's for a specific method).
The code execution is well spread around the methods. It's difficult to conclude.
It seems (I say, it seems) that the execution spend more time in recent versions in PICs. It could be that the machine code produced there is different because of:
- the abstraction with 32/64 bits
- the abstraction over literals for ARM
- the design changes, if I understood correctly now PIC are created from
a prototype. Now it could be something else.
I have no time to investigate further right now. Maybe we should try to generate PICs in 3427 and 3684 and check if the machine code is different. Which VMMaker version is 3427 ?
What do you guys think ?
It could be the longer jump in the new PICs, but I really doubt it. But there's something wrong with the VM profiler on linux. It is not showing any code in the interpreter run-time, and that might be hiding the real reason. I'll look at this as soon as I have time, but am committed to other things today and tomorrow.
The VM profiler does not show the interpreter run-time in Linux, and does
not work in Mac. I have no windows at hand so I am not able to help then.
Yeah I also doubt that it comes from the PICs. I could be.
_,,,^..^,,,_ best, Eliot
Is this problem solved or not ?
On Wed, Apr 27, 2016 at 8:30 PM, Clément Bera bera.clement@gmail.com wrote:
On Wed, Apr 27, 2016 at 7:28 PM, Eliot Miranda eliot.miranda@gmail.com wrote:
Hi Clément,
On Wed, Apr 27, 2016 at 7:03 AM, Clément Bera bera.clement@gmail.com wrote:
Hi,
So after *really* struggling I profiled Holger's code.
I put results in attachment with version 3427 and version 3684 of the VM.
Holger said the code is not open-source, so if you want more information about the code ask him (or I guess I can answer if it's for a specific method).
The code execution is well spread around the methods. It's difficult to conclude.
It seems (I say, it seems) that the execution spend more time in recent versions in PICs. It could be that the machine code produced there is different because of:
- the abstraction with 32/64 bits
- the abstraction over literals for ARM
- the design changes, if I understood correctly now PIC are created from
a prototype. Now it could be something else.
I have no time to investigate further right now. Maybe we should try to generate PICs in 3427 and 3684 and check if the machine code is different. Which VMMaker version is 3427 ?
What do you guys think ?
It could be the longer jump in the new PICs, but I really doubt it. But there's something wrong with the VM profiler on linux. It is not showing any code in the interpreter run-time, and that might be hiding the real reason. I'll look at this as soon as I have time, but am committed to other things today and tomorrow.
The VM profiler does not show the interpreter run-time in Linux, and does
not work in Mac. I have no windows at hand so I am not able to help then.
Yeah I also doubt that it comes from the PICs. I could be.
_,,,^..^,,,_ best, Eliot
On 04 Jul 2016, at 20:59, Clément Bera bera.clement@gmail.com wrote:
Hi!
Is this problem solved or not ?
not that I am aware of.
kind regards holger
Hi Holger,
I'm sorry for the delay since you reported the bug. Everyone working on the VM is very busy (In my case, my time is consumed by my phd and sista, I'm trying to open an alpha of the image+runtime before ESUG running at ~1.5x).
Now that the VM profiler is fully working I was able to look into the regression.
Old VM vanilla code:
27.94% (11.54%) scavengeReferentsOf (528) (27.94%) 10.21% ( 4.22%) processWeakSurvivor (193) (38.15%) 8.15% ( 3.36%) copyAndForward (154) (46.30%) 7.41% ( 3.06%) doScavenge (140) (53.70%) 5.19% ( 2.14%) lookupOrdinaryNoMNUEtcInClass (98) (58.89%) 4.71% ( 1.94%) primitiveStringReplace (89) (63.60%) 4.29% ( 1.77%) moveFramesInthroughtoPage (81) (67.88%) 2.06% ( 0.85%) isWidowedContext (39) (69.95%) [...] 0.90% ( 0.37%) ceSendFromInLineCacheMiss (17) (85.61%) 0.85% ( 0.35%) addNewMethodToCache (16) (86.46%)
New VM vanilla code:
% of vanilla vm code (% of total) (samples) (cumulative) 22.41% (10.44%) scavengeReferentsOf (609) (22.41%) *14.46% ( 6.74%) lookupOrdinaryNoMNUEtcInClass (393) (36.87%)* 6.88% ( 3.21%) copyAndForward (187) (43.75%) 6.59% ( 3.07%) processWeakSurvivor (179) (50.33%) * 6.36% ( 2.97%) addNewMethodToCache (173) (56.70%)* 4.19% ( 1.95%) doScavenge (114) (60.89%) 4.08% ( 1.90%) primitiveStringReplace (111) (64.97%) 2.91% ( 1.35%) moveFramesInthroughtoPage (79) (67.88%) * 2.87% ( 1.34%) ceSendFromInLineCacheMiss (78) (70.75%)* 2.21% ( 1.03%) marryFrameSP (60) (72.96%) 1.80% ( 0.84%) executeNewMethod (49) (74.76%) 1.36% ( 0.63%) isWidowedContext (37) (76.12%)
I highlighted the problematic methods. It is likely that it has to do with slang inlining.
The 3 methods highlighted seems to be responsible for an overhead of ~8.5% in the overall runtime. You seem to have an overhead of ~14% on my machine. There's quite a difference. The slang inlining overhead may have impacted other functions, and C profilers are never 100% accurate, so we will see when the problem is fixed if something else is also problematic. Now that we know what the problem is, I believe it will be fixed in the incoming weeks when someone (likely Eliot, maybe me) has time. Thanks for reporting the regression.
Regards
Clement
On Wed, Jul 6, 2016 at 8:00 PM, Holger Freyther holger@freyther.de wrote:
On 04 Jul 2016, at 20:59, Clément Bera bera.clement@gmail.com wrote:
Hi!
Is this problem solved or not ?
not that I am aware of.
kind regards holger
On 07 Jul 2016, at 19:41, Clément Bera bera.clement@gmail.com wrote:
Hi Holger,
Hi!
I'm sorry for the delay since you reported the bug. Everyone working on the VM is very busy (In my case, my time is consumed by my phd and sista, I'm trying to open an alpha of the image+runtime before ESUG running at ~1.5x).
great.
Now that the VM profiler is fully working I was able to look into the regression.
Old VM vanilla code:
27.94% (11.54%) scavengeReferentsOf (528) (27.94%) 10.21% ( 4.22%) processWeakSurvivor (193) (38.15%) 8.15% ( 3.36%) copyAndForward (154) (46.30%) 7.41% ( 3.06%) doScavenge (140) (53.70%) 5.19% ( 2.14%) lookupOrdinaryNoMNUEtcInClass (98) (58.89%) 4.71% ( 1.94%) primitiveStringReplace (89) (63.60%) 4.29% ( 1.77%) moveFramesInthroughtoPage (81) (67.88%) 2.06% ( 0.85%) isWidowedContext (39) (69.95%) [...] 0.90% ( 0.37%) ceSendFromInLineCacheMiss (17) (85.61%) 0.85% ( 0.35%) addNewMethodToCache (16) (86.46%)
New VM vanilla code:
% of vanilla vm code (% of total) (samples) (cumulative) 22.41% (10.44%) scavengeReferentsOf (609) (22.41%) 14.46% ( 6.74%) lookupOrdinaryNoMNUEtcInClass (393) (36.87%)
I highlighted the problematic methods. It is likely that it has to do with slang inlining.
The 3 methods highlighted seems to be responsible for an overhead of ~8.5% in the overall runtime. You seem to have an overhead of ~14% on my machine. There's quite a difference. The slang inlining overhead may have impacted other functions, and C profilers are never 100% accurate, so we will see when the problem is fixed if something else is also problematic. Now that we know what the problem is, I believe it will be fixed in the incoming weeks when someone (likely Eliot, maybe me) has time. Thanks for reporting the regression.
What does (393) and (98) mean? Is it number of samples?
holger
Yes. Number of samples and percentage of overall samples. You're right it's not that many. Here is the result when I run 5 times the bench (I usually use the profiler just as a hint to tweak performance, then the in-image results matter).
New VM:
% of vanilla vm code (% of total) (samples) (cumulative) 20.72% ( 9.98%) scavengeReferentsOf (2943) (20.72%) *10.52% ( 5.07%) lookupOrdinaryNoMNUEtcInClass (1494) (31.24%)* 6.63% ( 3.19%) processWeakSurvivor (941) (37.87%) 5.62% ( 2.71%) copyAndForward (798) (43.49%) * 4.94% ( 2.38%) addNewMethodToCache (702) (48.43%)* 4.86% ( 2.34%) doScavenge (690) (53.29%) 3.20% ( 1.54%) primitiveStringReplace (455) (56.50%) 3.06% ( 1.48%) moveFramesInthroughtoPage (435) (59.56%) 2.94% ( 1.42%) compact (418) (62.50%) * 2.87% ( 1.38%) interpret (407) (65.37%)* * 2.52% ( 1.21%) ceSendFromInLineCacheMiss (358) (67.89%)*
Old VM:
% of vanilla vm code (% of total) (samples) (cumulative) 27.19% (10.97%) scavengeReferentsOf (2615) (27.19%) 9.80% ( 3.95%) processWeakSurvivor (943) (36.99%) 8.76% ( 3.54%) copyAndForward (843) (45.75%) 7.06% ( 2.85%) doScavenge (679) (52.81%) 4.81% ( 1.94%) primitiveStringReplace (463) (57.63%) 4.28% ( 1.73%) moveFramesInthroughtoPage (412) (61.91%) *4.15% ( 1.67%) lookupOrdinaryNoMNUEtcInClass (399) (66.06%)* 2.44% ( 0.99%) marryFrameSP (235) (68.50%) 2.30% ( 0.93%) isWidowedContext (221) (70.80%) 2.19% ( 0.88%) handleStackOverflow (211) (72.99%) 1.64% ( 0.66%) primitiveCompareString (158) (74.63%) 1.50% ( 0.60%) findMethodWithPrimitiveFromContextUpToContext (144) (76.13%) 1.50% ( 0.60%) ceBaseFrameReturn (144) (77.63%) 1.45% ( 0.58%) ceStackOverflow (139) (79.07%) 1.16% ( 0.47%) ceNonLocalReturn (112) (80.24%) 1.11% ( 0.45%) allocateNewSpaceSlotsformatclassIndex (107) (81.35%) 1.00% ( 0.40%) isBytes (96) (82.35%) 0.95% ( 0.38%) fetchClassOfNonImm (91) (83.29%) 0.93% ( 0.37%) stackValue (89) (84.22%) 0.90% ( 0.36%) returnToExecutivepostContextSwitch (87) (85.12%) * 0.90% ( 0.36%) interpret (87) (86.03%)* * 0.84% ( 0.34%) addNewMethodToCache (81) (86.87%)* * 0.83% ( 0.34%) ceSendFromInLineCacheMiss (80) (87.70%)*
Now if I look at the 4 methods highlighted, instead of the 3 I looked at before, I see ~7% overhead. I'm not sure if compact got really slower or if it used to be inlined somewhere during slang compilation. I still think we should use these results as a hit and rely on the real benchmark for performance evaluation.
If it's really a slang inlining problem, it will have side-effect on other functions, many will get a little bit faster, and it really seems this is the problem.
On Thu, Jul 7, 2016 at 8:50 PM, Holger Freyther holger@freyther.de wrote:
On 07 Jul 2016, at 19:41, Clément Bera bera.clement@gmail.com wrote:
Hi Holger,
Hi!
I'm sorry for the delay since you reported the bug. Everyone working on
the VM is very busy (In my case, my time is consumed by my phd and sista, I'm trying to open an alpha of the image+runtime before ESUG running at ~1.5x).
great.
Now that the VM profiler is fully working I was able to look into the
regression.
Old VM vanilla code:
27.94% (11.54%) scavengeReferentsOf
(528) (27.94%)10.21% ( 4.22%) processWeakSurvivor
(193) (38.15%)8.15% ( 3.36%) copyAndForward
(154) (46.30%)7.41% ( 3.06%) doScavenge
(140) (53.70%)5.19% ( 2.14%) lookupOrdinaryNoMNUEtcInClass
(98) (58.89%)4.71% ( 1.94%) primitiveStringReplace
(89) (63.60%)4.29% ( 1.77%) moveFramesInthroughtoPage
(81) (67.88%)2.06% ( 0.85%) isWidowedContext
(39) (69.95%)[...] 0.90% ( 0.37%) ceSendFromInLineCacheMiss
(17) (85.61%)0.85% ( 0.35%) addNewMethodToCache
(16) (86.46%)New VM vanilla code:
% of vanilla vm code (% of total)
(samples) (cumulative)22.41% (10.44%) scavengeReferentsOf
(609) (22.41%)14.46% ( 6.74%) lookupOrdinaryNoMNUEtcInClass
(393) (36.87%)I highlighted the problematic methods. It is likely that it has to do
with slang inlining.
The 3 methods highlighted seems to be responsible for an overhead of
~8.5% in the overall runtime. You seem to have an overhead of ~14% on my machine. There's quite a difference. The slang inlining overhead may have impacted other functions, and C profilers are never 100% accurate, so we will see when the problem is fixed if something else is also problematic. Now that we know what the problem is, I believe it will be fixed in the incoming weeks when someone (likely Eliot, maybe me) has time. Thanks for reporting the regression.
What does (393) and (98) mean? Is it number of samples?
holger

Could also be something gone wonky with the interpreters method cache, causing excessive misses and the fallback code (lookupOrdinary... and addNewMethod..) to run. Initially I'd suspect there might've been changes that'd affect hashing (such as classTag - index in class table, being used instead of class pointer), but I guess that happened before the first version.
I would note, in the generated code for spur in the git repo, there's a case on top of addNewMethodToCache that doesn't actually add the found method to cache: if (!(((GIV(newMethod) & (tagMask())) == 0) && (((((usqInt) (longAt(GIV(newMethod)))) >> (formatShift())) & (formatMask())) >= (firstCompiledMethodFormat())))) { primitiveFunctionPointer = primitiveInvokeObjectAsMethod; return; }
I don't know exactly what firstCompiledMethodFormat() entails, but if it means found method that is a CompiledMethod, that would pretty much mean the MethodCache is entirely unused, no?
Cheers, Henry
On 07 Jul 2016, at 10:04 , Clément Bera bera.clement@gmail.com wrote:
Yes. Number of samples and percentage of overall samples. You're right it's not that many. Here is the result when I run 5 times the bench (I usually use the profiler just as a hint to tweak performance, then the in-image results matter).
New VM:
% of vanilla vm code (% of total) (samples) (cumulative) 20.72% ( 9.98%) scavengeReferentsOf (2943) (20.72%) 10.52% ( 5.07%) lookupOrdinaryNoMNUEtcInClass (1494) (31.24%) 6.63% ( 3.19%) processWeakSurvivor (941) (37.87%) 5.62% ( 2.71%) copyAndForward (798) (43.49%) 4.94% ( 2.38%) addNewMethodToCache (702) (48.43%) 4.86% ( 2.34%) doScavenge (690) (53.29%) 3.20% ( 1.54%) primitiveStringReplace (455) (56.50%) 3.06% ( 1.48%) moveFramesInthroughtoPage (435) (59.56%) 2.94% ( 1.42%) compact (418) (62.50%) 2.87% ( 1.38%) interpret (407) (65.37%) 2.52% ( 1.21%) ceSendFromInLineCacheMiss (358) (67.89%)
Old VM:
% of vanilla vm code (% of total) (samples) (cumulative) 27.19% (10.97%) scavengeReferentsOf (2615) (27.19%) 9.80% ( 3.95%) processWeakSurvivor (943) (36.99%) 8.76% ( 3.54%) copyAndForward (843) (45.75%) 7.06% ( 2.85%) doScavenge (679) (52.81%) 4.81% ( 1.94%) primitiveStringReplace (463) (57.63%) 4.28% ( 1.73%) moveFramesInthroughtoPage (412) (61.91%) 4.15% ( 1.67%) lookupOrdinaryNoMNUEtcInClass (399) (66.06%) 2.44% ( 0.99%) marryFrameSP (235) (68.50%) 2.30% ( 0.93%) isWidowedContext (221) (70.80%) 2.19% ( 0.88%) handleStackOverflow (211) (72.99%) 1.64% ( 0.66%) primitiveCompareString (158) (74.63%) 1.50% ( 0.60%) findMethodWithPrimitiveFromContextUpToContext (144) (76.13%) 1.50% ( 0.60%) ceBaseFrameReturn (144) (77.63%) 1.45% ( 0.58%) ceStackOverflow (139) (79.07%) 1.16% ( 0.47%) ceNonLocalReturn (112) (80.24%) 1.11% ( 0.45%) allocateNewSpaceSlotsformatclassIndex (107) (81.35%) 1.00% ( 0.40%) isBytes (96) (82.35%) 0.95% ( 0.38%) fetchClassOfNonImm (91) (83.29%) 0.93% ( 0.37%) stackValue (89) (84.22%) 0.90% ( 0.36%) returnToExecutivepostContextSwitch (87) (85.12%) 0.90% ( 0.36%) interpret (87) (86.03%) 0.84% ( 0.34%) addNewMethodToCache (81) (86.87%) 0.83% ( 0.34%) ceSendFromInLineCacheMiss (80) (87.70%)
Now if I look at the 4 methods highlighted, instead of the 3 I looked at before, I see ~7% overhead. I'm not sure if compact got really slower or if it used to be inlined somewhere during slang compilation. I still think we should use these results as a hit and rely on the real benchmark for performance evaluation.
If it's really a slang inlining problem, it will have side-effect on other functions, many will get a little bit faster, and it really seems this is the problem.
On Thu, Jul 7, 2016 at 8:50 PM, Holger Freyther <holger@freyther.de mailto:holger@freyther.de> wrote:
On 07 Jul 2016, at 19:41, Clément Bera <bera.clement@gmail.com mailto:bera.clement@gmail.com> wrote:
Hi Holger,
Hi!
I'm sorry for the delay since you reported the bug. Everyone working on the VM is very busy (In my case, my time is consumed by my phd and sista, I'm trying to open an alpha of the image+runtime before ESUG running at ~1.5x).
great.
Now that the VM profiler is fully working I was able to look into the regression.
Old VM vanilla code:
27.94% (11.54%) scavengeReferentsOf (528) (27.94%) 10.21% ( 4.22%) processWeakSurvivor (193) (38.15%) 8.15% ( 3.36%) copyAndForward (154) (46.30%) 7.41% ( 3.06%) doScavenge (140) (53.70%) 5.19% ( 2.14%) lookupOrdinaryNoMNUEtcInClass (98) (58.89%) 4.71% ( 1.94%) primitiveStringReplace (89) (63.60%) 4.29% ( 1.77%) moveFramesInthroughtoPage (81) (67.88%) 2.06% ( 0.85%) isWidowedContext (39) (69.95%) [...] 0.90% ( 0.37%) ceSendFromInLineCacheMiss (17) (85.61%) 0.85% ( 0.35%) addNewMethodToCache (16) (86.46%)
New VM vanilla code:
% of vanilla vm code (% of total) (samples) (cumulative) 22.41% (10.44%) scavengeReferentsOf (609) (22.41%) 14.46% ( 6.74%) lookupOrdinaryNoMNUEtcInClass (393) (36.87%)
I highlighted the problematic methods. It is likely that it has to do with slang inlining.
The 3 methods highlighted seems to be responsible for an overhead of ~8.5% in the overall runtime. You seem to have an overhead of ~14% on my machine. There's quite a difference. The slang inlining overhead may have impacted other functions, and C profilers are never 100% accurate, so we will see when the problem is fixed if something else is also problematic. Now that we know what the problem is, I believe it will be fixed in the incoming weeks when someone (likely Eliot, maybe me) has time. Thanks for reporting the regression.
What does (393) and (98) mean? Is it number of samples?
holger
Hi Henrik,
On Tue, Jul 12, 2016 at 1:07 AM, Henrik Johansen < henrik.s.johansen@veloxit.no> wrote:
Could also be something gone wonky with the interpreters method cache, causing excessive misses and the fallback code (lookupOrdinary... and addNewMethod..) to run. Initially I'd suspect there might've been changes that'd affect hashing (such as classTag - index in class table, being used instead of class pointer), but I guess that happened before the first version.
I would note, in the generated code for spur in the git repo, there's a case on top of addNewMethodToCache that doesn't actually add the found method to cache: if (!(((GIV(newMethod) & (tagMask())) == 0) && (((((usqInt) (longAt(GIV(newMethod)))) >> (formatShift())) & (formatMask())) >= (firstCompiledMethodFormat())))) { primitiveFunctionPointer = primitiveInvokeObjectAsMethod; return; }
I don't know exactly what firstCompiledMethodFormat() entails, but if it means found method that is a CompiledMethod, that would pretty much mean the MethodCache is entirely unused, no?
The expression is ! (not) "is it non-immediate with compiled method format". So this expression adds the primitiveInvokeObjectAsMethod as the primitive whenever what the lookup finds is /not/ a compiled method. This is the implementation of "objects as methods". All compiled methods are non-immediates and have a format >= firstCompiledMethodFormat:
Behavior>>instSpec "Answer the instance specification part of the format that defines what kind of object an instance of the receiver is. The formats are 0 = 0 sized objects (UndefinedObject True False et al) 1 = non-indexable objects with inst vars (Point et al) 2 = indexable objects with no inst vars (Array et al) 3 = indexable objects with inst vars (MethodContext AdditionalMethodState et al) 4 = weak indexable objects with inst vars (WeakArray et al) 5 = weak non-indexable objects with inst vars (ephemerons) (Ephemeron) 6 = unused 7 = immediates (SmallInteger, Character) 8 = unused 9 = 64-bit indexable 10-11 = 32-bit indexable (Bitmap) (plus one odd bit, unused in 32-bits) 12-15 = 16-bit indexable (plus two odd bits, one unused in 32-bits) 16-23 = 8-bit indexable (plus three odd bits, one unused in 32-bits) 24-31 = compiled methods (CompiledMethod) (plus three odd bits, one unused in 32-bits) Note that in the VM instances also have a 5 bit format field that relates to their class's format. Formats 11, 13-15, 17-23 & 25-31 are unused in classes but used in instances to define the number of elements missing up to the slot size. For example, a 2-byte ByteString instance has format 18 in 32-bits, since its size is one 32-bit slot - 2 bytes ((18 bitAnd: 3) = 2), and 22 in 64 bits, since its size is one 64-bit slot - 6 bytes ((22 bitAnd: 7) = 6)." ^(format bitShift: -16) bitAnd: 16r1F
So the format encodes both "it is a compiled method" and the number of unused trailing elements.
Cheers, Henry
On 07 Jul 2016, at 10:04 , Clément Bera bera.clement@gmail.com wrote:
Yes. Number of samples and percentage of overall samples. You're right it's not that many. Here is the result when I run 5 times the bench (I usually use the profiler just as a hint to tweak performance, then the in-image results matter).
New VM:
% of vanilla vm code (% of total) (samples) (cumulative) 20.72% ( 9.98%) scavengeReferentsOf (2943) (20.72%) *10.52% ( 5.07%) lookupOrdinaryNoMNUEtcInClass (1494) (31.24%)* 6.63% ( 3.19%) processWeakSurvivor (941) (37.87%) 5.62% ( 2.71%) copyAndForward (798) (43.49%)
- 4.94% ( 2.38%) addNewMethodToCache (702) (48.43%)*
4.86% ( 2.34%) doScavenge (690) (53.29%) 3.20% ( 1.54%) primitiveStringReplace (455) (56.50%) 3.06% ( 1.48%) moveFramesInthroughtoPage (435) (59.56%) 2.94% ( 1.42%) compact (418) (62.50%)
- 2.87% ( 1.38%) interpret (407) (65.37%)*
- 2.52% ( 1.21%) ceSendFromInLineCacheMiss (358) (67.89%)*
Old VM:
% of vanilla vm code (% of total) (samples) (cumulative) 27.19% (10.97%) scavengeReferentsOf (2615) (27.19%) 9.80% ( 3.95%) processWeakSurvivor (943) (36.99%) 8.76% ( 3.54%) copyAndForward (843) (45.75%) 7.06% ( 2.85%) doScavenge (679) (52.81%) 4.81% ( 1.94%) primitiveStringReplace (463) (57.63%) 4.28% ( 1.73%) moveFramesInthroughtoPage (412) (61.91%) *4.15% ( 1.67%) lookupOrdinaryNoMNUEtcInClass (399) (66.06%)* 2.44% ( 0.99%) marryFrameSP (235) (68.50%) 2.30% ( 0.93%) isWidowedContext (221) (70.80%) 2.19% ( 0.88%) handleStackOverflow (211) (72.99%) 1.64% ( 0.66%) primitiveCompareString (158) (74.63%) 1.50% ( 0.60%) findMethodWithPrimitiveFromContextUpToContext (144) (76.13%) 1.50% ( 0.60%) ceBaseFrameReturn (144) (77.63%) 1.45% ( 0.58%) ceStackOverflow (139) (79.07%) 1.16% ( 0.47%) ceNonLocalReturn (112) (80.24%) 1.11% ( 0.45%) allocateNewSpaceSlotsformatclassIndex (107) (81.35%) 1.00% ( 0.40%) isBytes (96) (82.35%) 0.95% ( 0.38%) fetchClassOfNonImm (91) (83.29%) 0.93% ( 0.37%) stackValue (89) (84.22%) 0.90% ( 0.36%) returnToExecutivepostContextSwitch (87) (85.12%)
- 0.90% ( 0.36%) interpret (87) (86.03%)*
- 0.84% ( 0.34%) addNewMethodToCache (81) (86.87%)*
- 0.83% ( 0.34%) ceSendFromInLineCacheMiss (80) (87.70%)*
Now if I look at the 4 methods highlighted, instead of the 3 I looked at before, I see ~7% overhead. I'm not sure if compact got really slower or if it used to be inlined somewhere during slang compilation. I still think we should use these results as a hit and rely on the real benchmark for performance evaluation.
If it's really a slang inlining problem, it will have side-effect on other functions, many will get a little bit faster, and it really seems this is the problem.
On Thu, Jul 7, 2016 at 8:50 PM, Holger Freyther holger@freyther.de wrote:
On 07 Jul 2016, at 19:41, Clément Bera bera.clement@gmail.com wrote:
Hi Holger,
Hi!
I'm sorry for the delay since you reported the bug. Everyone working on
the VM is very busy (In my case, my time is consumed by my phd and sista, I'm trying to open an alpha of the image+runtime before ESUG running at ~1.5x).
great.
Now that the VM profiler is fully working I was able to look into the
regression.
Old VM vanilla code:
27.94% (11.54%) scavengeReferentsOf
(528) (27.94%)10.21% ( 4.22%) processWeakSurvivor
(193) (38.15%)8.15% ( 3.36%) copyAndForward
(154) (46.30%)7.41% ( 3.06%) doScavenge
(140) (53.70%)5.19% ( 2.14%) lookupOrdinaryNoMNUEtcInClass
(98) (58.89%)4.71% ( 1.94%) primitiveStringReplace
(89) (63.60%)4.29% ( 1.77%) moveFramesInthroughtoPage
(81) (67.88%)2.06% ( 0.85%) isWidowedContext
(39) (69.95%)[...] 0.90% ( 0.37%) ceSendFromInLineCacheMiss
(17) (85.61%)0.85% ( 0.35%) addNewMethodToCache
(16) (86.46%)New VM vanilla code:
% of vanilla vm code (% of total)
(samples) (cumulative)22.41% (10.44%) scavengeReferentsOf
(609) (22.41%)14.46% ( 6.74%) lookupOrdinaryNoMNUEtcInClass
(393) (36.87%)I highlighted the problematic methods. It is likely that it has to do
with slang inlining.
The 3 methods highlighted seems to be responsible for an overhead of
~8.5% in the overall runtime. You seem to have an overhead of ~14% on my machine. There's quite a difference. The slang inlining overhead may have impacted other functions, and C profilers are never 100% accurate, so we will see when the problem is fixed if something else is also problematic. Now that we know what the problem is, I believe it will be fixed in the incoming weeks when someone (likely Eliot, maybe me) has time. Thanks for reporting the regression.
What does (393) and (98) mean? Is it number of samples?
holger

On Sat, Apr 23, 2016 at 7:48 PM, Eliot Miranda eliot.miranda@gmail.com wrote:
Plugins: Upgrade LargeIntegersPlugin to v2.0 LargeInteger primitives now deal with 32-bits digits. No change to image code.
Memory is 8 bytes aligned on Spur. When storing 32/64 bits large integers values, allways fill the eight bytes whatever the effectivily used size, rather than bother with dissertion of size.
Generate integer type checking as C macros rather than direct/indirect interpreterProxy function call in plugins. This, and 32-bit accessing mean singificantly faster large integer arithmetic.
Awesome! The legs are in the architecture endianness? What are the reasons to not use GMP? Could we use it if was already installed in the host platform? It seems to me that it would be quite straight forward to call to the GMP low-level API from the LargeIntegersPlugin, without making any changes in the image. https://gmplib.org/manual/Low_002dlevel-Functions.html

2016-07-12 22:24 GMT+02:00 Luciano Notarfrancesco luchiano@gmail.com:
On Sat, Apr 23, 2016 at 7:48 PM, Eliot Miranda eliot.miranda@gmail.com wrote:
Plugins: Upgrade LargeIntegersPlugin to v2.0 LargeInteger primitives now deal with 32-bits digits. No change to image code.
Memory is 8 bytes aligned on Spur. When storing 32/64 bits large integers values, allways fill the eight bytes whatever the effectivily used size, rather than bother with dissertion of size.
Generate integer type checking as C macros rather than direct/indirect interpreterProxy function call in plugins. This, and 32-bit accessing mean singificantly faster large integer arithmetic.
Awesome! The legs are in the architecture endianness? What are the reasons to not use GMP? Could we use it if was already installed in the host platform? It seems to me that it would be quite straight forward to call to the GMP low-level API from the LargeIntegersPlugin, without making any changes in the image. https://gmplib.org/manual/Low_002dlevel-Functions.html
Yes, it would be a nice projet to write a GMPLargeIntegersPlugin.
GNU smalltalk is using gmp already, so it might be quite easy, no need to re-invent, just to rewrite. GMP is LGPL, I don't know the impact on our VM, but it in no way a show stopper for experimentation.
Hi Luciano,
On Jul 12, 2016, at 1:24 PM, Luciano Notarfrancesco luchiano@gmail.com wrote:
On Sat, Apr 23, 2016 at 7:48 PM, Eliot Miranda eliot.miranda@gmail.com wrote: Plugins: Upgrade LargeIntegersPlugin to v2.0 LargeInteger primitives now deal with 32-bits digits. No change to image code.
Memory is 8 bytes aligned on Spur. When storing 32/64 bits large integers values, allways fill the eight bytes whatever the effectivily used size, rather than bother with dissertion of size.
Generate integer type checking as C macros rather than direct/indirect interpreterProxy function call in plugins. This, and 32-bit accessing mean singificantly faster large integer arithmetic.
Awesome! The legs are in the architecture endianness? What are the reasons to not use GMP?
1. the existing code is functional and adequate. GMP offers no new functionality and may offer performance improvements or may not. But the existing code is capable of being tuned also.
2. The existing plugin is internal; with the "new" linkage I wrote two years ago now internal plugins have a much simpler call interface into the VM (no double calls through a pointer anymore; just direct calls on the VM functions). But LGPL forces us to make the plugin external. Hence using GMP implies a loss of performance in marshaling arguments and allocating and returning results.
IMO these two together make GMP irrelevant. Less compelling reasons are
3. Yet another library to install on all build environments; AFAIA it's not present on non-Linux platforms
4. Being a library we don't control we're dependent on others fixing it.
What reasons, other than brand identity are there for using GMP?
Could we use it if was already installed in the host platform? It seems to me that it would be quite straight forward to call to the GMP low-level API from the LargeIntegersPlugin, without making any changes in the image. https://gmplib.org/manual/Low_002dlevel-Functions.html
Hi Eliot, My only point is performance. GMP is highly optimized, it includes optimizations made by hand for each particular processor, so for example the multiplication of large enough integers should be much faster than our implementation in Slang. And it seems that we wouldn't need to change anything in the image or do any conversions or marshaling, just call the mpn_* low-level functions from the large integers plugin. But if we have to marshal everything it doesn't make much sense to use GMP, because it will be slower for relatively small large integers.
I'm working on computer algebra in Smalltalk and I'd like to be competitive with other computer algebra systems (GAP, Magma, etc), and in many cases the bottleneck is large integer arithmetic.
So I'm very happy about the recent speed up using 32 bits legs and avoiding function calls for type checking. That will have an impact in my benchmarks. Thanks!
On Wed, Jul 13, 2016 at 12:52 PM, Eliot Miranda eliot.miranda@gmail.com wrote:
- the existing code is functional and adequate. GMP offers no new
functionality and may offer performance improvements or may not. But the existing code is capable of being tuned also.
- The existing plugin is internal; with the "new" linkage I wrote two
years ago now internal plugins have a much simpler call interface into the VM (no double calls through a pointer anymore; just direct calls on the VM functions). But LGPL forces us to make the plugin external. Hence using GMP implies a loss of performance in marshaling arguments and allocating and returning results.
IMO these two together make GMP irrelevant. Less compelling reasons are
- Yet another library to install on all build environments; AFAIA it's
not present on non-Linux platforms
- Being a library we don't control we're dependent on others fixing it.
What reasons, other than brand identity are there for using GMP?
Could we use it if was already installed in the host platform? It seems to me that it would be quite straight forward to call to the GMP low-level API from the LargeIntegersPlugin, without making any changes in the image. https://gmplib.org/manual/Low_002dlevel-Functions.html
Hi Luciano,
On Wed, Jul 13, 2016 at 9:59 AM, Luciano Notarfrancesco luchiano@gmail.com wrote:
Hi Eliot, My only point is performance. GMP is highly optimized, it includes optimizations made by hand for each particular processor, so for example the multiplication of large enough integers should be much faster than our implementation in Slang. And it seems that we wouldn't need to change anything in the image or do any conversions or marshaling, just call the mpn_* low-level functions from the large integers plugin. But if we have to marshal everything it doesn't make much sense to use GMP, because it will be slower for relatively small large integers.
I'm working on computer algebra in Smalltalk and I'd like to be competitive with other computer algebra systems (GAP, Magma, etc), and in many cases the bottleneck is large integer arithmetic.
So I'm very happy about the recent speed up using 32 bits legs and avoiding function calls for type checking. That will have an impact in my benchmarks. Thanks!
Well, I won't stand in the way of you gaining more performance; quite the opposite; I encourage it. If you have energy here please apply it. But it would be nice if you added the speedups to our code base rather than introduced a dependency on GMP.
I was going to suggest working with Sista, but that leaves the interpreter VMs out in the cold.
On Wed, Jul 13, 2016 at 12:52 PM, Eliot Miranda eliot.miranda@gmail.com wrote:
- the existing code is functional and adequate. GMP offers no new
functionality and may offer performance improvements or may not. But the existing code is capable of being tuned also.
- The existing plugin is internal; with the "new" linkage I wrote two
years ago now internal plugins have a much simpler call interface into the VM (no double calls through a pointer anymore; just direct calls on the VM functions). But LGPL forces us to make the plugin external. Hence using GMP implies a loss of performance in marshaling arguments and allocating and returning results.
IMO these two together make GMP irrelevant. Less compelling reasons are
- Yet another library to install on all build environments; AFAIA it's
not present on non-Linux platforms
- Being a library we don't control we're dependent on others fixing it.
What reasons, other than brand identity are there for using GMP?
Could we use it if was already installed in the host platform? It seems to me that it would be quite straight forward to call to the GMP low-level API from the LargeIntegersPlugin, without making any changes in the image. https://gmplib.org/manual/Low_002dlevel-Functions.html
On Wed, Jul 13, 2016 at 5:06 PM, Eliot Miranda eliot.miranda@gmail.com wrote:
Well, I won't stand in the way of you gaining more performance; quite the opposite; I encourage it. If you have energy here please apply it. But it would be nice if you added the speedups to our code base rather than introduced a dependency on GMP.
Yes, it would be awesome to improve large integer performance without introducing a dependency on GMP. I think the smallest thing that would have the biggest impact in performance is implementing highly optimized multiplication (and perhaps division) for x86/x86_64/arm. If it was not because of the license problems, we could just copy a couple of .S files straight from GMP source code...
Now I'm very much focused on the Smalltalk side of my project. But if no one does it first, I'll give it a shot.
I was going to suggest working with Sista, but that leaves the interpreter
VMs out in the cold.
Yeah, I'm looking forward to Sista. I was planning to implement some primitives for what I think are the main bottlenecks (mostly operations with arrays of integers or arrays of integers mod n where n fits in a 32 bits register for example), but I'm kind of (speculatively) hoping that speculative optimizations might achieve similar performance as writing those primitives in C \o/
vm-dev@lists.squeakfoundation.org
-
 Clément Bera
 -
 Eliot Miranda
 -
 Henrik Johansen
 -
 Holger Freyther
 -
 Levente Uzonyi
 -
 Luciano Notarfrancesco
 -
 Nicolas Cellier